 Cloudera
Cloudera Community Edition on AWS in One Command
Updated:
Cloudera has a lot of ways to get a cluster. Almost none of them are “one command on your laptop.” cloudera-labs/cloudera-ce-aws is the exception: a Terraform + Ansible bundle that stands up a full Cloudera Private Cloud Community Edition cluster on AWS — Cloudera Manager, Kerberos, Auto-TLS, a real storage/compute topology — from a single ansible-navigator run. This post is me taking my freshly-released fork from zero to a running Ozone cluster, and the handful of real snags between the README and a green Cloudera Manager.
Everything here is field-run against cloudera-ce-aws v1.0.0, deploying Cloudera Manager 7.13.2 / Runtime 7.3.2, from an Apple-Silicon Mac into AWS account AWS SE in us-east-2.
What it actually deploys
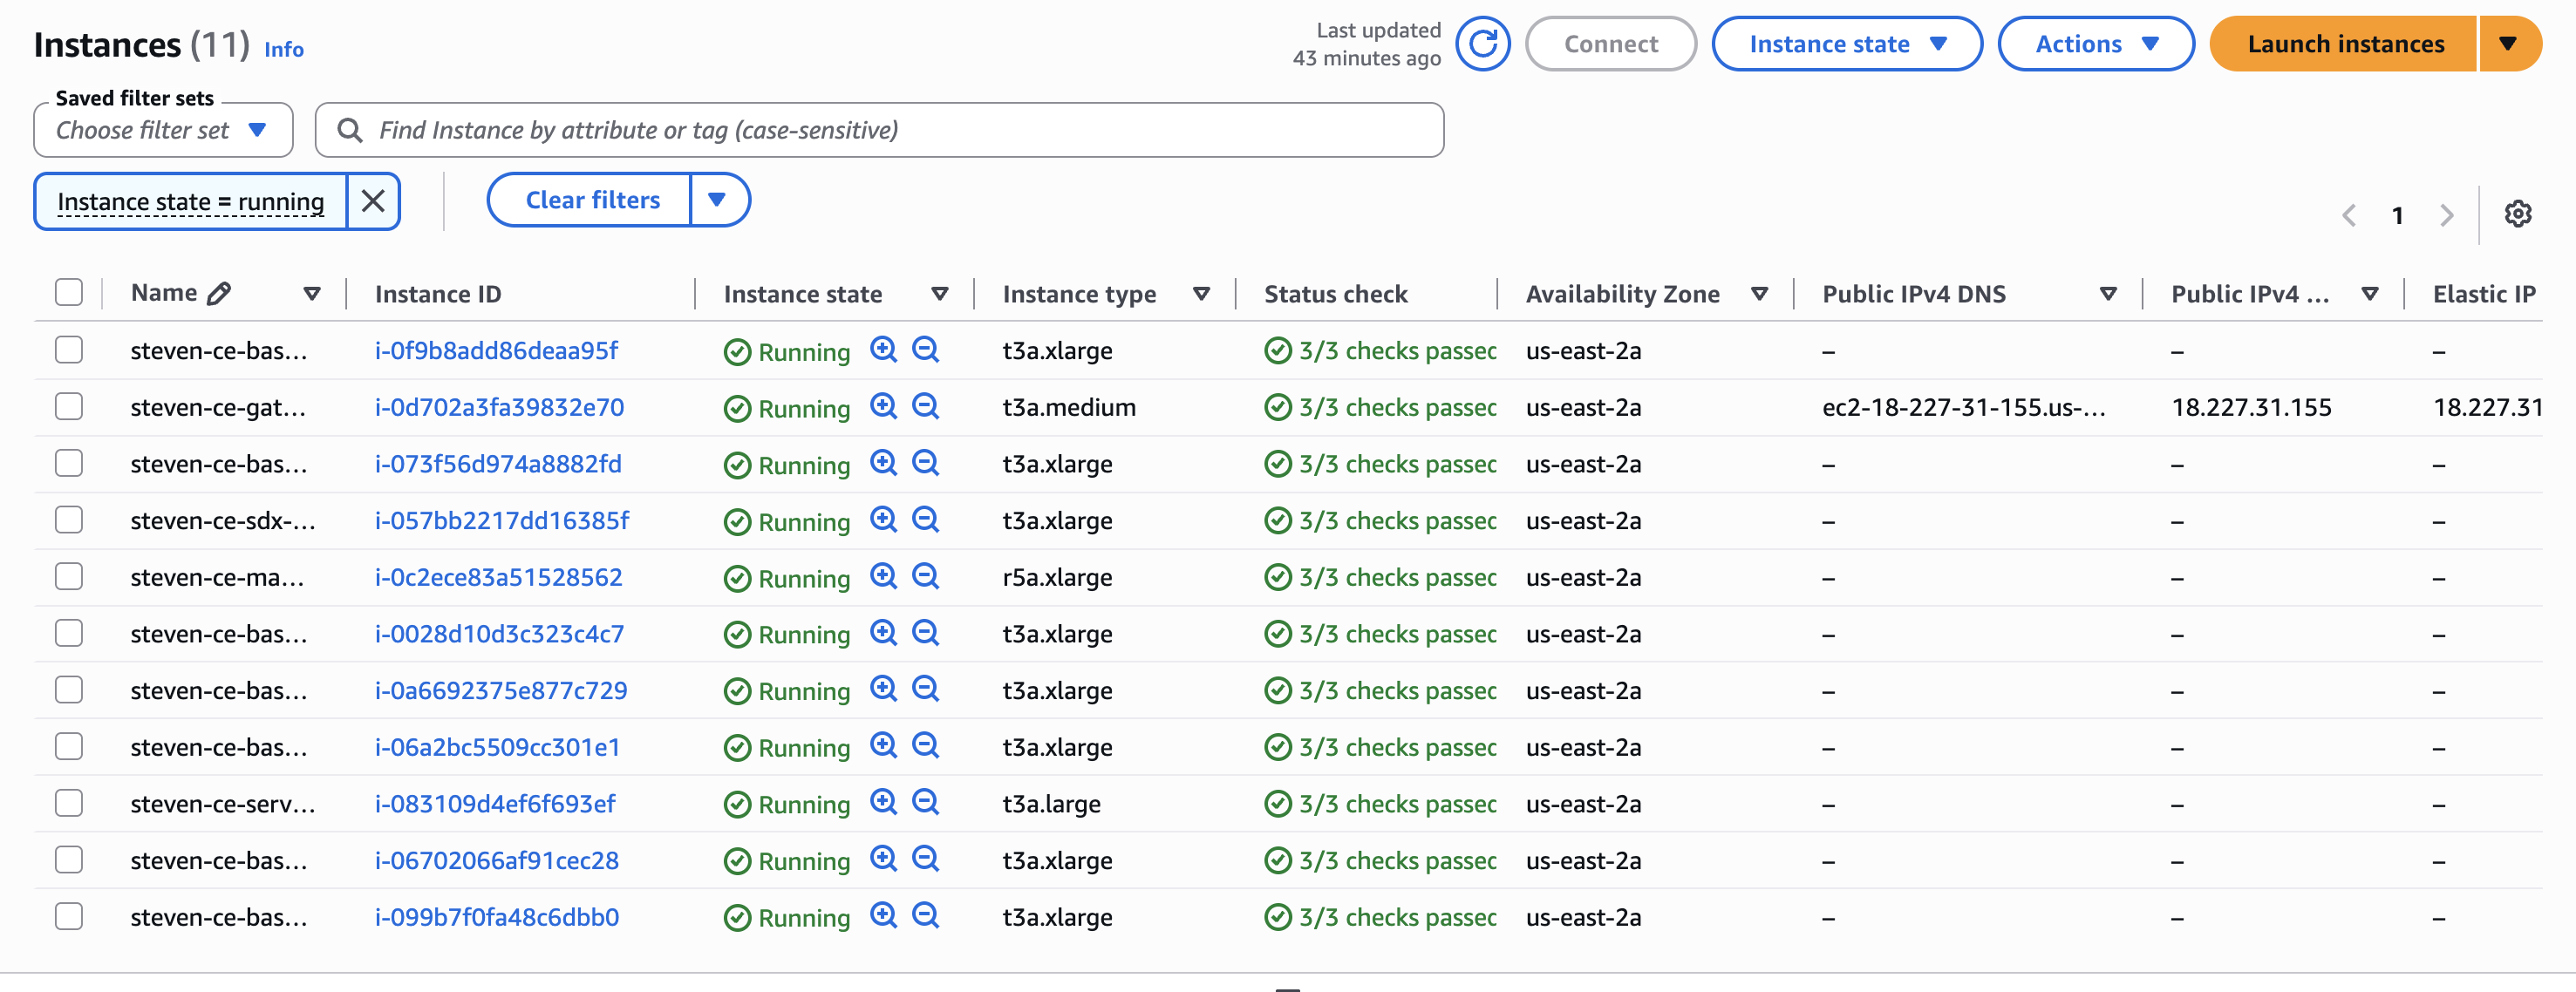
A ring-fenced cluster — ~11 EC2 nodes — with everything a real Cloudera deployment has and a laptop demo usually fakes:
- Cloudera Manager with Kerberos and Auto-TLS
- Self-contained DNS, Kerberos (FreeIPA), PostgreSQL, and TLS (ACME-managed certs on a Caddy reverse proxy)
- A selectable topology — Ozone, Kafka, Flink, NiFi, CSA, or ECS — each its own playbook
- Reverse HTTPS proxies + SSH as the only ways in; the cluster is otherwise sealed
The whole thing is idempotent: re-running produces no unintended changes. The node roles and default sizing (t3a for most, one r5a.xlarge for CMS):
| Role | Count | Instance |
|---|---|---|
| gateway | 1 | t3a.medium |
| services | 1 | t3a.large |
| masters | 3 | t3a.xlarge |
| workers | 4 | t3a.xlarge |
| cms | 1 | r5a.xlarge |
| sdx | 1 | t3a.xlarge |
At on-demand rates that’s roughly ~$2/hr / ~$45/day — worth a pause.yml between sessions (stops EC2, keeps EBS) if you’re leaving it up.
The setup is genuinely minimal
Every dependency — Terraform, Ansible, all the collections — is baked into an Ansible execution-environment container image. Locally you need almost nothing:
git clone https://github.com/cloudera-labs/cloudera-ce-aws.git
cd cloudera-ce-aws
python -m venv ~/cdp-navigator && source ~/cdp-navigator/bin/activate
pip install ansible-core ansible-navigator
Plus a container runtime (Docker or Podman) and two credentials: AWS SSO and a Cloudera license .txt.
# AWS SSO — the config uses your SSO profile to mint short-lived creds
aws sso login --profile YOUR_PROFILE

# Cloudera Private Cloud license — the text file, NOT the .zip
export CDP_LICENSE_FILE=/path/to/license.txt
Then a three-line config.yml:
name_prefix: "steven-ce"
infra_region: "us-east-2"
common_password: "<min 8 chars, 1 number>"
owner_email: "you@cloudera.com"
And the one command that does everything:
ansible-navigator run playbooks/infrastructure.yml playbooks/services.yml \
  playbooks/cms.yml playbooks/ozone-cluster.yml -e @config.yml -m stdout
Four playbooks, four stages: Terraform provisions the AWS infra → Ansible configures DNS/Kerberos/DB/TLS → Cloudera Manager comes up → the Ozone cluster deploys.
The snags between README and a running cluster
The quickstart is clean, but seven things cost me time — exactly the stuff a reveal post should call out. The first four are one-time setup friction; the last three are genuine traps in the v1.0.0 release.
1. The :latest EE image tag isn’t published
ansible-navigator.yml points the execution environment at ghcr.io/cloudera-labs/cloudera-ce-aws:latest. That tag doesn’t exist — the registry only publishes 1.0.0-amd64:
Error response from daemon: failed to resolve reference
"ghcr.io/cloudera-labs/cloudera-ce-aws:latest": not found
Fix — pin the real tag in ansible-navigator.yml:
image: ghcr.io/cloudera-labs/cloudera-ce-aws:1.0.0-amd64
2. The EE image is amd64-only — on Apple Silicon it runs emulated
The only published arch is -amd64. On an M-series Mac the image runs under emulation; make it explicit so Docker doesn’t guess:
    container-options:
      - "--network=host"
      - "--platform=linux/amd64"
The EE is an orchestration controller — it drives Terraform and SSHes to the nodes; it isn’t doing heavy local compute — so emulation is a non-issue for throughput here.
3. “Logged into AWS” (console) ≠ AWS CLI has credentials
I was logged into the AWS access portal in the browser, but the CLI had no profile, no cached token, nothing — NoCredentials. The fix is aws configure sso, but the trap is subtler: after setup my default profile carried the sso_session but was missing sso_account_id and sso_role_name, so it still couldn’t resolve credentials. A complete profile:
[sso-session Cloudera-Main-SSO]
sso_start_url = https://d-xxxxxxxxxx.awsapps.com/start#/
sso_region = us-east-1
sso_registration_scopes = sso:account:access

[profile cldr-se]
sso_session = Cloudera-Main-SSO
sso_account_id = 007856030109
sso_role_name = cldr_poweruser
region = us-east-2
aws sts get-caller-identity --profile cldr-se should return your assumed-role ARN. That token is cached on disk, so it survives across shells — which matters because the deploy consumes the creds via aws configure export-credentials.
4. common_password and config.yml are secrets in a public repo
config.yml holds a plaintext password and your fork is public. It’s in .gitignore (alongside *.pem and *.tfstate) — confirm that before you commit anything, because a leaked common_password there unlocks every service in the cluster.
5. Keep common_password alphanumeric — special characters break service enrollment
 Hint — this one cost me a full teardown. Make
 common_password letters and digits only. Cloudera’s automation sets service admin passwords through basic-auth API calls shaped like https://admin:PASSWORD@host/..., so an @ or # inside the password corrupts the URL’s userinfo section and enrollment fails — and the task is no_log, so the error is censored and you can’t see why. Alphanumeric still satisfies the “min 8 chars, 1 number” rule; you lose nothing.
My first run had common_password full of special characters (#, @). The deploy sailed through Terraform and most of the services stage, then died on:
TASK [cloudera.exe.grafana : Set Grafana admin password if API login fails]
fatal: [<services-node>]: FAILED! => {"censored": "... 'no_log: true' ..."}
The result is censored (no_log), but the cause is the password: common_password feeds service admin passwords that get set via basic-auth API calls (https://admin:PASSWORD@host/...). An @ inside the password breaks URL userinfo parsing, so the API login/set fails. The same password later feeds CM, Ranger, Knox, Hue, and SMM — so this isn’t a Grafana quirk, it’s a landmine for every API-set credential downstream.
Fix: keep common_password alphanumeric (letters + digits, meets the “min 8, 1 number” rule without @ # $ / :). Because the password is baked into FreeIPA/DB/services as they’re provisioned, the clean fix is a teardown + redeploy with the safe password, not an in-place change.
6. enable_prometheus is declared twice — Grafana runs even when you think it’s off
config-template.yml implies Prometheus/Grafana is off by default (# enable_prometheus: false). But group_vars/all.yml defines the key twice — false, then true further down — and last-wins in YAML, so the effective default is true. That’s why the Grafana tasks ran (and hit gotcha #5) even though I never enabled them. If you don’t want the monitoring stack, set enable_prometheus: false explicitly in your config.yml so it overrides the duplicate.
7. tee-ing an ansible-navigator run hides the real exit code
The EE launches with --tty, so piping the run through tee sends output to the container’s PTY (the pipe stays empty) and reports the pipeline’s exit code (tee’s 0) rather than ansible’s. A run that actually failed looked like it succeeded. Watch the run with docker logs -f <ansible_runner_container> instead, and trust the PLAY RECAP failed= counts, not the shell exit code.
The deploy, stage by stage
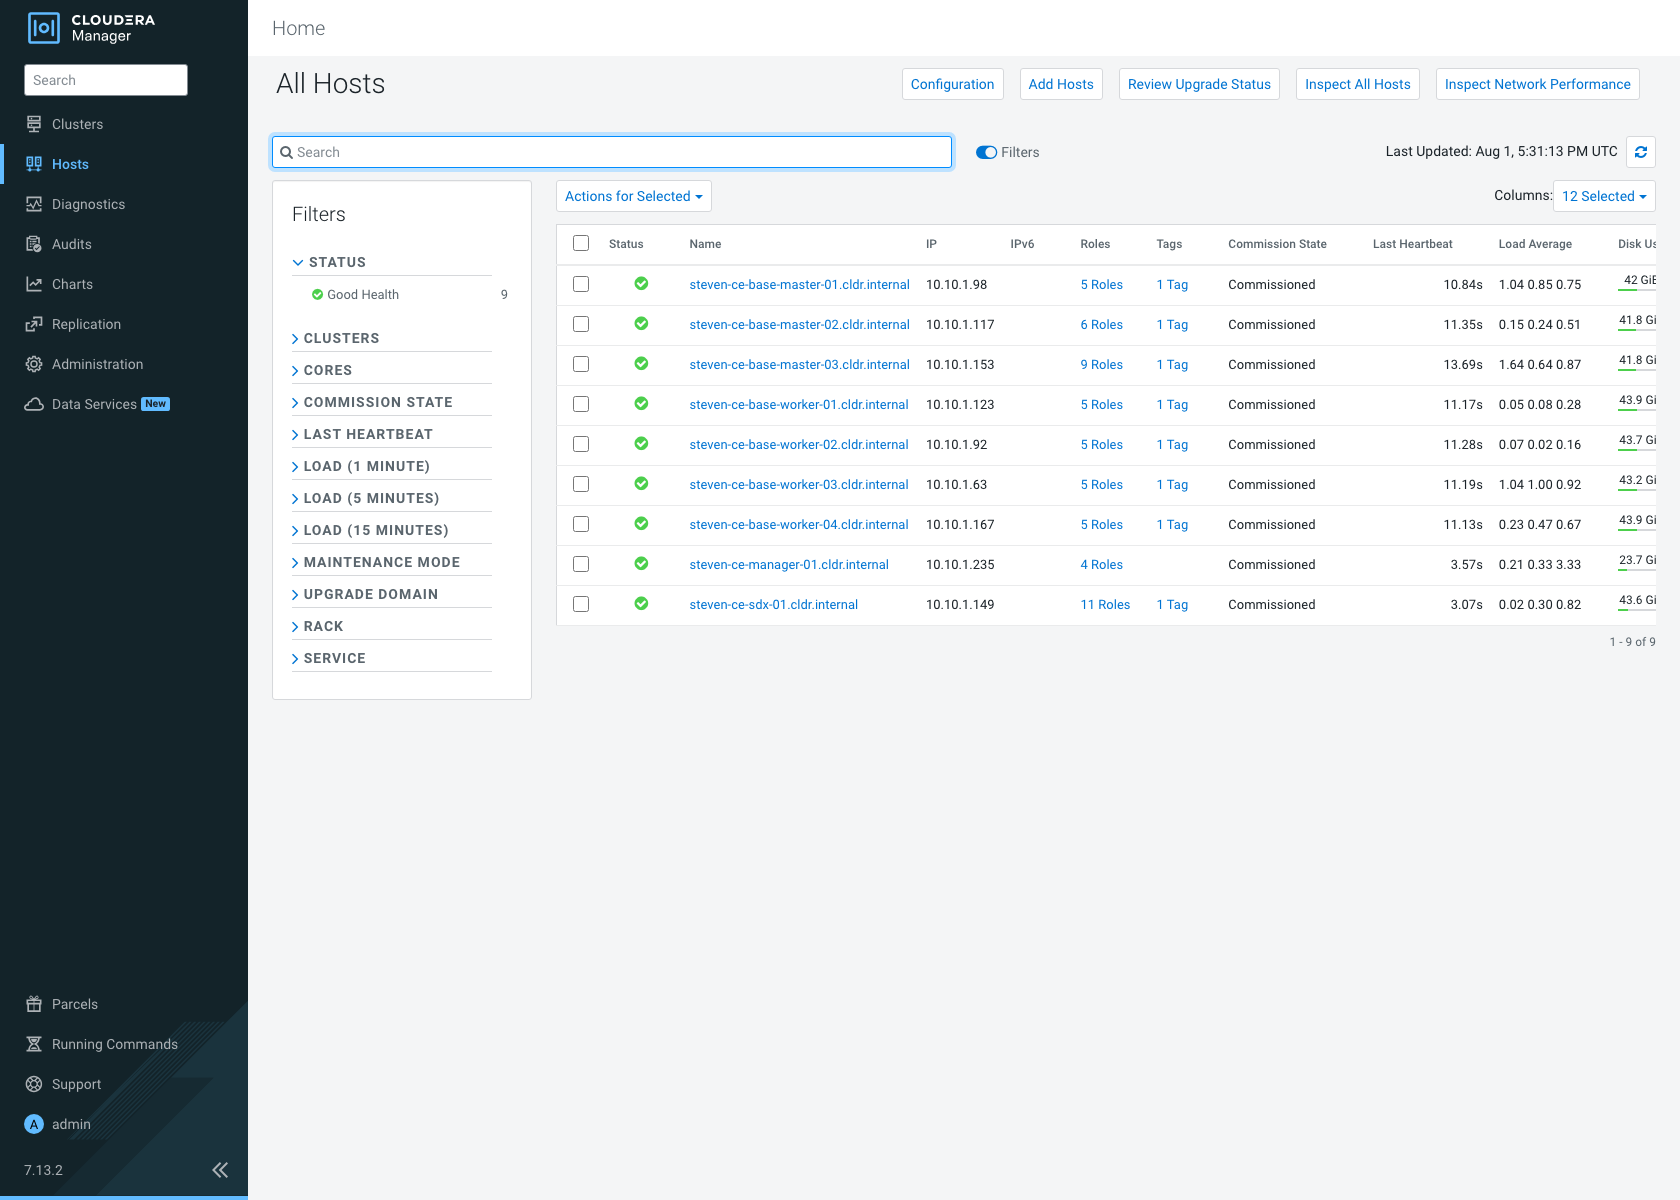
One ansible-navigator run chains four playbooks. On my run — Apple-Silicon Mac, amd64 EE under emulation, default instance sizes — the full stand-up took about 2.5 hours end to end. The long poles are parcel distribution and bringing 14 Kerberized services up, not the Terraform infra (which was ~10 min); native amd64 and larger nodes would cut this down.
| Stage | Playbook | What happens |
|---|---|---|
| 1 | infrastructure.yml |
Terraform: VPC, security groups, 11 EC2 nodes, generated SSH key |
| 2 | services.yml |
FreeIPA (DNS + Kerberos), PostgreSQL, Caddy/TLS, Node Exporter, Prometheus/Grafana |
| 3 | cms.yml |
Cloudera Manager install + license, CM agents, AutoTLS, CM Kerberos |
| 4 | ozone-cluster.yml |
CM builds the cluster: distribute/activate parcels, assign roles, start services |
Every stage ended failed=0. The final recap across all 11 hosts:
PLAY RECAP
steven-ce-base-master-01.cldr.internal : ok=197 changed=75  unreachable=0 failed=0
steven-ce-base-master-02.cldr.internal : ok=197 changed=75  unreachable=0 failed=0
steven-ce-base-master-03.cldr.internal : ok=197 changed=75  unreachable=0 failed=0
steven-ce-base-worker-01.cldr.internal : ok=197 changed=75  unreachable=0 failed=0
   ... workers 02–04 identical ...
steven-ce-gateway-01.cldr.internal     : ok=93  changed=55  unreachable=0 failed=0
steven-ce-manager-01.cldr.internal     : ok=182 changed=79  unreachable=0 failed=0
steven-ce-sdx-01.cldr.internal         : ok=196 changed=75  unreachable=0 failed=0
steven-ce-services-01.cldr.internal    : ok=205 changed=121 unreachable=0 failed=0
One thing worth knowing: right after the Ozone stage completes, the CM cluster can briefly show BAD_HEALTH while ZooKeeper’s startup canary settles — it flips to GOOD on its own within a couple minutes. Don’t panic-restart it.
What you get at the end
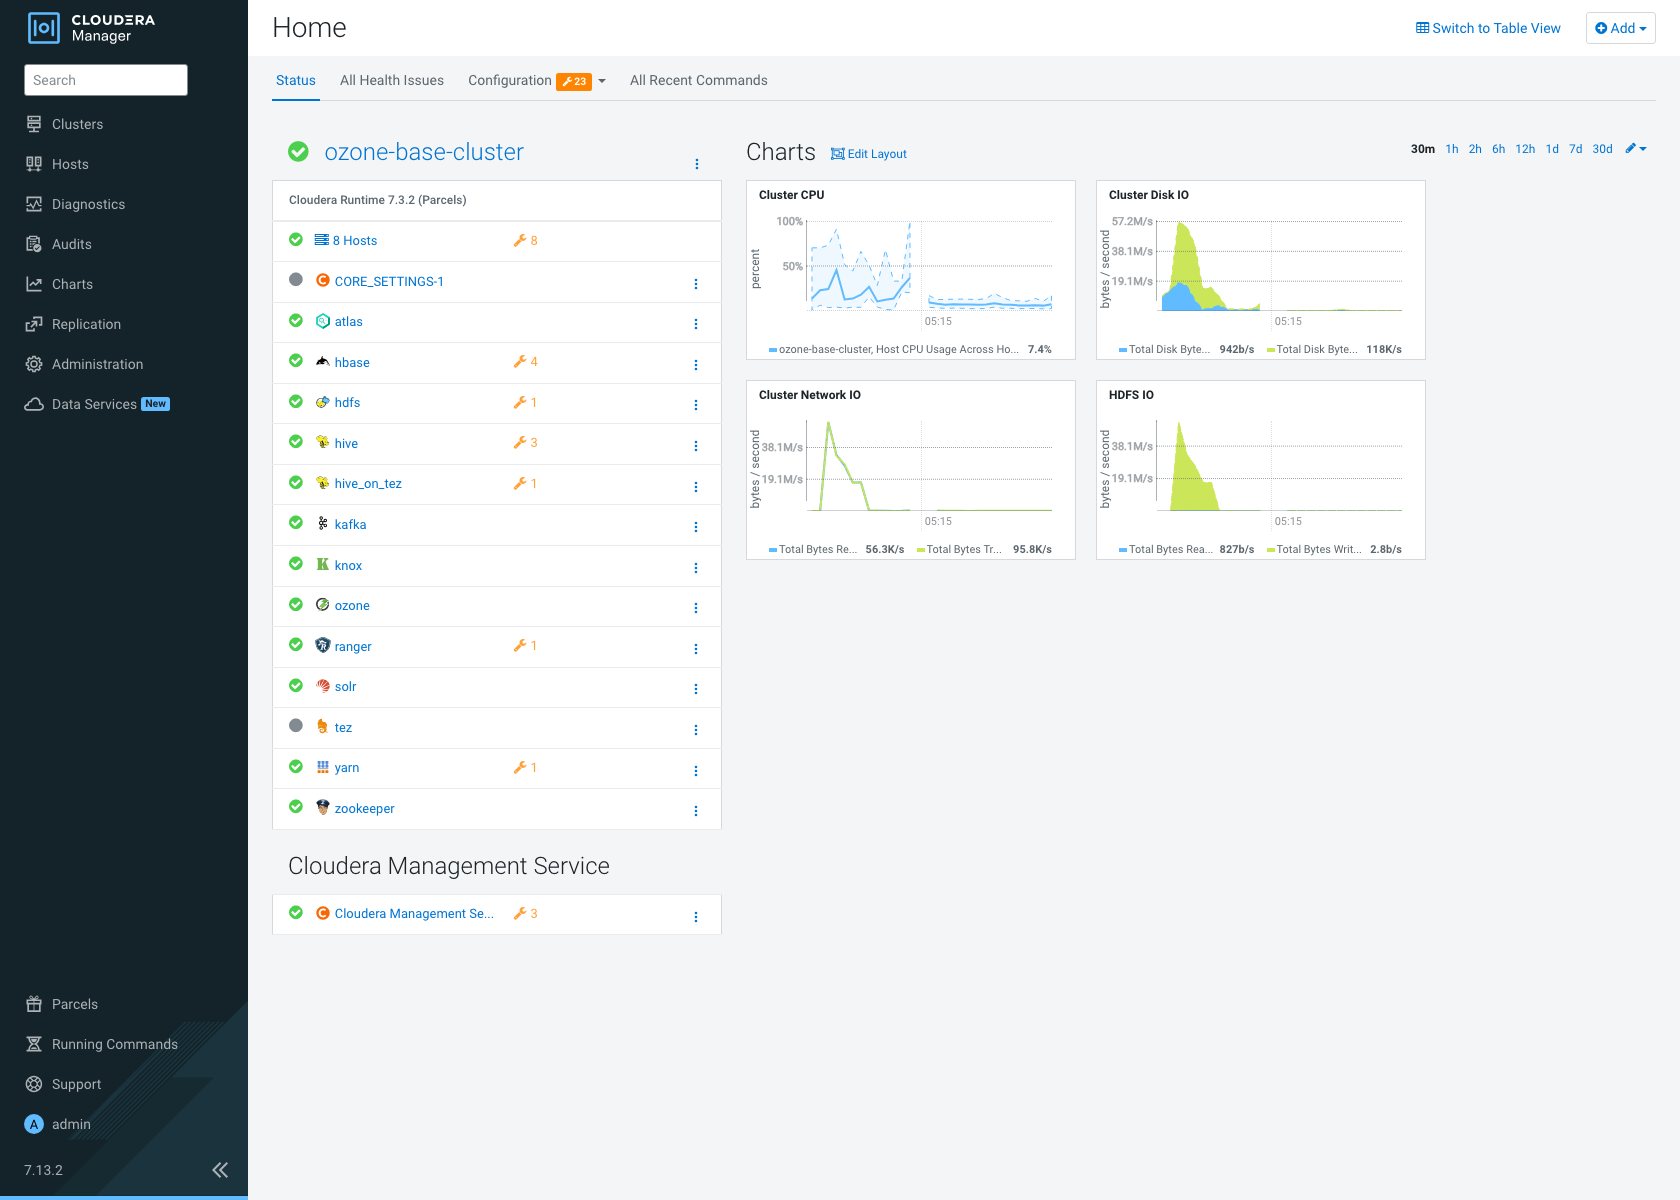
A GOOD_HEALTH ozone-base-cluster on Cloudera Runtime 7.3.2, reachable through the Caddy reverse proxy on the single public node (the gateway) via a nip.io hostname:
-
Cloudera Manager:
https://cm.<gateway-public-ip>.nip.io—admin/ yourcommon_password -
Cluster health (straight from the CM API): cluster
GOOD_HEALTH; all 14 services GOOD — HDFS, Ozone, Kafka, YARN, Hive, Hive-on-Tez, HBase, Ranger, Knox, Atlas, Solr, ZooKeeper, Tez, Core Settings. - Only the gateway node has a public IP; every other node is private and reached through the proxy — the ring-fenced design the README promises.
Cost control — pause, resume, tear down
The cluster bills ~$2/hr while it runs, so know the exits up front. All three are the same one-command shape:
# Pause — stop the EC2 instances, keep the EBS volumes + cluster state (cheapest way to keep it around)
ansible-navigator run playbooks/pause.yml -e @config.yml -m stdout

# Resume — start the instances back up
ansible-navigator run playbooks/resume.yml -e @config.yml -m stdout

# Tear down — Terraform destroys everything: instances, volumes, VPC
ansible-navigator run playbooks/infrastructure-teardown.yml -e @config.yml -m stdout
Teardown is a terraform destroy under the hood and finishes in a few minutes with a clean recap:
PLAY RECAP
localhost : ok=3 changed=1 unreachable=0 failed=0
Then confirm nothing is left billing before you walk away — Terraform state should be empty and AWS should report zero instances:
aws ec2 describe-instances --profile <your-profile> --region us-east-2 \
  --filters "Name=tag:deployment,Values=<name_prefix>" \
            "Name=instance-state-name,Values=running,pending,stopping,stopped" \
  --query 'length(Reservations[].Instances[])' --output text
# -> 0
What NOT to do
-
Don’t trust the
:latestEE tag — pin1.0.0-amd64. - Don’t assume console login = CLI creds — configure an SSO profile with account and role.
-
Don’t commit
config.yml— it holds a plaintext password; keep it gitignored. -
Don’t use the license
.zip—CDP_LICENSE_FILEwants the.txt. -
Don’t leave it running unwatched —
pause.ymlorinfrastructure-teardown.ymlwhen you’re done.
Cloudera Community Edition on AWS in One Command
If you would like a deeper dive, hands on experience, demos, or are interested in speaking with me further about Cloudera Community Edition on AWS in One Command please reach out to schedule a discussion.